- Analytics
- Retention
- Cross-platform
How to measure browser extension retention and uninstall rate without over-collecting data
What store user counts really measure, how to calculate extension uninstall rate and cohort retention, and a minimal telemetry setup that stays policy-safe.
- Author
- Extenify Team
- Published
- Reading time
- 13 min read

On this page
Installs are the number everyone watches, and the one that says the least about whether an extension is healthy. An extension can gain a thousand installs a week and still shrink, because the people who try it leave faster than new ones arrive. What tells you whether the product works is retention: how many people keep it, and how quickly the rest remove it.
Measuring that has become more delicate in 2026. The Chrome Web Store now expects any data you collect to be strictly necessary for your single purpose, Firefox asks users to consent to data collection at install time, and browsers ship a new version every two weeks, so a retention drop can start without any release from you. This guide covers what the store dashboards already tell you, how to turn their exports into an uninstall rate and a retention curve, and a small telemetry setup that fills the gaps without tracking individual users.
Key takeaways
- Store "users" numbers are not active users. Chrome's documentation says its users stats capture installations and do not monitor whether users are active. Edge counts users with the extension on, off or in an unknown state over seven days.
- Weekly users is not installs minus uninstalls. Sync across devices, dormant browsers and removals outside the store all move it independently.
- An uninstall rate is only comparable over time if you fix the formula. Divide uninstalls by average weekly users, not by installs in the same period.
- Cohort retention needs a little first-party data. A once-a-day ping with an install week and a version, and no user ID, is enough.
runtime.setUninstallURLis the cheapest uninstall signal you have. Put coarse context in the URL, never an identifier.
What each store actually counts
Every store dashboard has a users chart, and none of them counts the same thing. Before calculating anything, know what the inputs mean.
| Store | Headline user metric | How the store describes it | Other exports |
|---|---|---|---|
| Chrome Web Store | Weekly users | "The Users stats only captures installations; it doesn't monitor whether users are active or not." | Daily installs, daily uninstalls, impressions, enabled vs disabled |
| Microsoft Edge Add-ons | Weekly users | Users that have the extension turned on, turned off and status unknown over the past seven days | Daily installs, impressions, enabled vs disabled |
| Firefox Add-ons (AMO) | Daily users | Aggregated from Firefox telemetry data, without personally identifiable data | Downloads from the AMO listing, with UTM breakdowns |
Sources: Chrome's store listing metrics documentation and the analytics revamp announcement, Microsoft's Edge extensions analytics dashboard page, and Mozilla's monitoring extension usage statistics guide.
Three consequences follow.
- Weekly users is a footprint, not engagement. Someone who installed your extension a year ago and never clicked it still counts, as long as their browser is running it. The Enabled vs Disabled breakdown on Chrome and Edge is the closest thing to an engagement signal the stores give you.
- Firefox counts daily, Chrome and Edge count weekly. Do not add them into one "total users" figure and call it active users. You can add them to show reach, but label it as such.
- Firefox downloads only cover the AMO listing. Mozilla notes that installs of an
.xpifrom your own site are not counted, even when the file is hosted on AMO.
Google does not publish the exact method behind its weekly users figure, and it has never promised that the number reconciles with installs and uninstalls. Treat it as a trend line. The same caveat applies to the public number shown on each listing, which is what competitors see and what tracking your extension across Chrome, Edge and Firefox is built on.
Why weekly users is not installs minus uninstalls
The first thing most developers try is a running total: last week's users, plus this week's installs, minus this week's uninstalls. It never matches. That is expected, not a bug in your spreadsheet.
- Sync multiplies installs. A user signed in on three machines can show up as three browsers running your extension after a single install from the store.
- Dormant browsers come and go. A laptop that stays closed for weeks can fall out of a weekly count without anyone uninstalling anything, then reappear when it is opened again.
- Not every loss is an uninstall. Deleting a browser profile or wiping a machine takes the extension out of use without anyone clicking Remove, so there may be no matching event in the uninstall chart.
- Installs are counted where the store sees them. Firefox's download count, for example, only includes installs from the AMO listing page.
So use each number for what it is good at. Installs and uninstalls are events: use them for rates. Weekly or daily users is a stock: use it for trends and as the denominator of those rates.
Calculating an uninstall rate you can compare month to month
There is no official formula for an extension uninstall rate, so you have to pick one and keep it. The two common choices answer different questions.
Option 1: uninstalls per install
uninstalls in period / installs in period
This is easy to compute from the Chrome export, but it mixes two populations. The people uninstalling this week are mostly not the people who installed this week. A launch week with a burst of installs makes the rate look excellent; a quiet month makes it look terrible, even if nothing changed in the product.
Option 2: uninstalls per active base (recommended)
uninstalls in period / average weekly users in period
This measures the share of your installed base you lose per period, which is the number that compounds. It barely moves when marketing spikes installs, so a change in it usually means something changed in the product, the browser or the competition.
A worked example with illustrative round numbers:
| Month | Installs | Uninstalls | Avg weekly users | Uninstalls per install | Uninstalls per base |
|---|---|---|---|---|---|
| July | 9,000 | 3,100 | 52,000 | 34% | 6.0% |
| August (launch campaign) | 21,000 | 3,600 | 58,000 | 17% | 6.2% |
| September | 8,500 | 4,700 | 60,000 | 55% | 7.8% |
The per-install rate halves in August and then jumps to 55% in September, which suggests a crisis that is mostly an artifact of the campaign. The per-base rate tells the real story: stable through the launch, then a real rise in September worth investigating.
Where the numbers come from
- In the Chrome Web Store developer dashboard, open Installs & Uninstalls and Weekly Users for your item and export both as CSV.
- In Partner Center, open Extension overview, then Analytics, and export Weekly users and Installs. The Edge dashboard does not report uninstalls, so for Edge you can only track installs and the weekly users trend, or rely on your own uninstall page (below).
- On AMO, open the statistics dashboard for daily users and downloads.
- Keep the exports in one sheet with a column per store, and add a column for your own release dates and for browser stable releases. Most September-style jumps line up with one or the other.
Measuring retention with a minimal ping
Store dashboards cannot tell you what share of the people who installed in the first week of August are still using the extension in October. That is cohort retention, and you need your own data for it. The good news is that you need very little.
The design below has no user identifier, no URLs, no page content and no IP logging on your side. Each installation sends at most one ping per UTC day, carrying three fields:
- the ISO week of install (the cohort), for example
2026-W32 - the extension version
- the browser family (
chrome,edgeorfirefox)
Because each installation pings at most once a day, the count of pings for a cohort on a given day is the number of installations from that cohort that were active that day. Divide by the number of install events for the same cohort and you have a retention curve, without ever knowing who anyone is.
// background.js (Manifest V3 background service worker)
const ENDPOINT = 'https://telemetry.example.com/v1/ping';

function isoWeek(date) {
  const d = new Date(Date.UTC(date.getUTCFullYear(), date.getUTCMonth(), date.getUTCDate()));
  const day = d.getUTCDay() || 7;
  d.setUTCDate(d.getUTCDate() + 4 - day);
  const yearStart = new Date(Date.UTC(d.getUTCFullYear(), 0, 1));
  const week = Math.ceil(((d - yearStart) / 86400000 + 1) / 7);
  return `${d.getUTCFullYear()}-W${String(week).padStart(2, '0')}`;
}

async function send(type) {
  const { cohort } = await chrome.storage.local.get('cohort');
  if (!cohort || !(await telemetryAllowed())) return;
  try {
    await fetch(ENDPOINT, {
      method: 'POST',
      headers: { 'content-type': 'application/json' },
      body: JSON.stringify({
        type, // "install" or "active"
        cohort,
        version: chrome.runtime.getManifest().version,
        browser: BROWSER_FAMILY, // set per build: "chrome", "edge" or "firefox"
      }),
    });
  } catch {
    // Offline or blocked: skip this ping rather than queueing data.
  }
}

async function dailyPing() {
  const today = new Date().toISOString().slice(0, 10);
  const { lastPing } = await chrome.storage.local.get('lastPing');
  if (lastPing === today) return;
  await chrome.storage.local.set({ lastPing: today });
  await send('active');
}

chrome.runtime.onInstalled.addListener(async ({ reason }) => {
  if (reason === 'install') {
    await chrome.storage.local.set({ cohort: isoWeek(new Date()) });
    await send('install');
  }
  await refreshUninstallUrl(); // defined in the next section
});

// Alarms may not survive a browser restart, so ensure one exists on every worker
// start. Only create it when missing: re-creating resets the schedule.
chrome.alarms.get('daily-ping').then((alarm) => {
  if (!alarm) chrome.alarms.create('daily-ping', { periodInMinutes: 180 });
});
chrome.alarms.onAlarm.addListener((alarm) => {
  if (alarm.name === 'daily-ping') dailyPing();
});
chrome.runtime.onStartup.addListener(dailyPing);
A few details matter here:
- Check often, send once. The alarm fires every few hours and the stored date makes sure only one ping goes out per day. Chrome's alarms API limits alarms to at most one every 30 seconds and can delay them, so do not rely on exact timing.
- Existing users have no cohort. Installations from before you shipped this code will not have a stored cohort. The sketch above skips them. If you want to include them, give them a fixed cohort such as
legacyrather than guessing a date. telemetryAllowed()is where consent lives. On Chrome and Edge, that means respecting any opt-out you offer and disclosing the collection. On Firefox, it means checking the built-in consent that users set at install time. The mechanics are covered in our guide to Firefox data collection consent for extensions.- Keep the server boring. Aggregate by day, cohort, version and browser, and drop request logs. If you would not be comfortable showing the stored table to a reviewer, it holds too much.
If you already use Google Analytics, Chrome's guide to using Google Analytics 4 in an extension shows how to send events through the Measurement Protocol, since Manifest V3 does not allow loading remote analytics scripts. That approach relies on a stored random client ID. It works, but it is more data than retention strictly needs, so weigh it against your disclosure.
Reading the retention table
Once the pings arrive, build a table with one row per install week and one column per week since install. The figures below are illustrative:
| Install week | Installs | Week 1 | Week 2 | Week 4 | Week 8 |
|---|---|---|---|---|---|
| 2026-W28 | 2,140 | 61% | 52% | 44% | 38% |
| 2026-W32 | 5,380 | 48% | 39% | 31% | |
| 2026-W36 | 1,960 | 63% | 55% |
Read it in two directions. Down a column, you see whether newer cohorts keep the extension better or worse than older ones. Across a row, you see where the curve flattens: the point after which people who stay tend to stay. In the example, the W32 cohort came from a paid campaign and retains worse at every step, which is a question about audience, not about the product.
Tracking uninstalls with runtime.setUninstallURL
runtime.setUninstallURL opens a page of your choice when someone removes the extension. Chrome's runtime API reference describes it as a way to "clean up server-side data, do analytics, and implement surveys", with a maximum of 1023 characters. Firefox supports the same method, with the same limit and an http or https scheme, per MDN.
The useful trick is that you can call it again at any time. Update the URL whenever context changes, and the page you receive carries that context:
const GOODBYE = 'https://example.com/goodbye';

async function refreshUninstallUrl() {
  // No telemetry consent: still show the survey, but without any context.
  if (!(await telemetryAllowed())) return chrome.runtime.setUninstallURL(GOODBYE);
  const { cohort } = await chrome.storage.local.get('cohort');
  const params = new URLSearchParams({
    v: chrome.runtime.getManifest().version,
    c: cohort ?? 'legacy',
    b: BROWSER_FAMILY,
  });
  await chrome.runtime.setUninstallURL(`${GOODBYE}?${params}`);
}

// Called from the onInstalled listener above (after the cohort is stored),
// and again on every browser start in case consent changed.
chrome.runtime.onStartup.addListener(refreshUninstallUrl);
With that in place, your goodbye page can count uninstalls by version and by cohort, which is exactly what you need to answer "did version 4.2 make people leave?" or "how quickly do August installs give up?".
Three rules keep this safe and honest:
- No identifiers in the URL. No user ID, no email, no license key. The page opens in a normal tab and the URL can end up in history, analytics tools and server logs.
- Treat it as a sample. Not every removal opens the page, and many people close the tab immediately. The count is a lower bound; the dashboard uninstall chart remains the reference for Chrome.
- Make the survey short and optional. One question with four or five reasons ("did not work on a site I use", "slowed my browser", "found an alternative", "only needed it once") plus a free text box gets far more answers than a form.
Putting store data and your own data together
Neither source is enough alone. Store numbers cover everyone but say little; your own pings say more but only about users who allow them. Used together they cover each other's blind spots:
- Compare your active pings with store users. The ratio between your daily active pings and AMO daily users, or your weekly unique-day pings and Chrome weekly users, tells you roughly how much of the base your telemetry sees. A sudden change in that ratio usually means a bug in your telemetry, not a change in users.
- Line up every drop with a release. Put your release dates and browser stable dates on the same chart as uninstalls per base. With browsers now shipping every two weeks, a drop that starts on a browser release day with no release of yours is worth testing on the new version first.
- Watch the public numbers of your competitors. You will never see their uninstalls, but the public user count on each listing shows whether a category is growing or whether one product is taking users from the rest. That context separates "our retention got worse" from "the whole category shrank".
- Watch reviews next to retention. Uninstall survey answers and new low-star reviews usually describe the same problem in different words. The habits in reading review and rating trends apply directly.
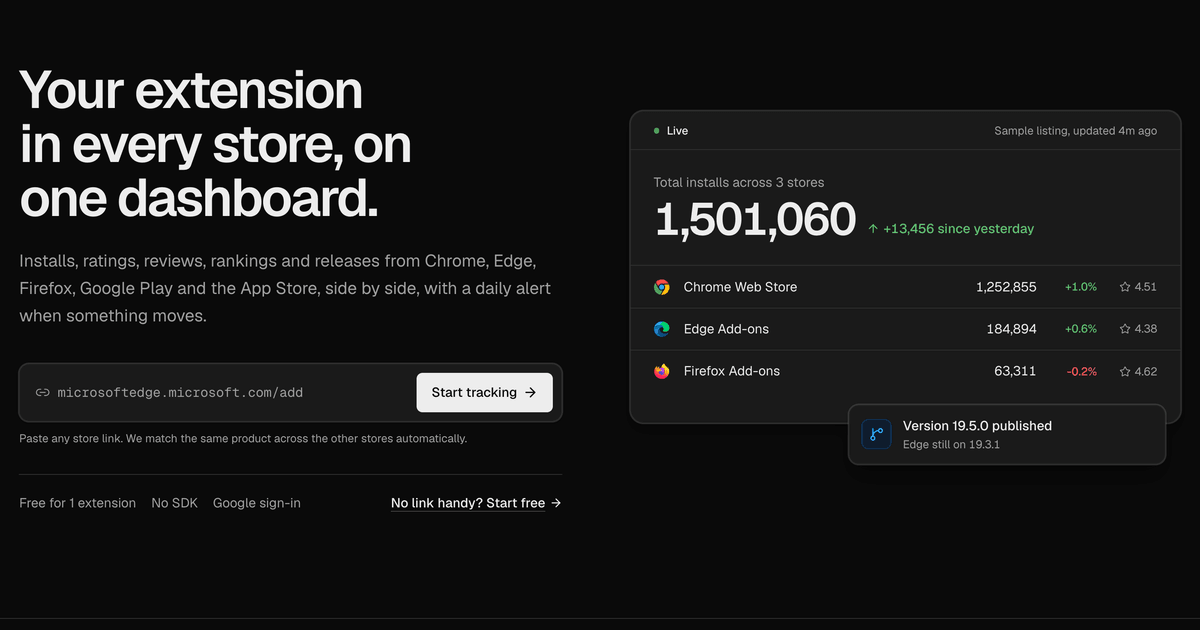
Extenify captures the public user count of every listing you track once a day, on every store, and reports changes such as Installs falling, Install growth slowing and Install growth turned negative in the daily digest. That gives you the outside view for your own extension and your competitors without adding any code to the extension. For the first week after a release, pair it with the checklist in what to watch after an extension release.
Frequently asked questions
What is a normal uninstall rate for a browser extension?
There is no published benchmark from Google, Microsoft or Mozilla, and third-party figures use different formulas. Compare your extension against its own history using one fixed formula, ideally uninstalls divided by average weekly users, and investigate changes rather than absolute values.
Does the Chrome Web Store user count show active users?
No. Chrome's documentation says the users stats capture installations and do not monitor whether users are active. Use the Enabled vs Disabled breakdown, or your own daily ping, if you need an activity signal.
Can I track retention without a user ID?
Yes. If each installation stores its install week locally and sends at most one ping per day with that week, the ping count per cohort per day equals active installations for that cohort. Divide by the cohort's install count to get retention, with no identifier involved.
Is the uninstall URL allowed under store policies?
Chrome and Firefox both document setUninstallURL for analytics and surveys. What matters is what you put in it: coarse, non-identifying context such as version and install week is easy to justify, while user identifiers are not. Disclose it along with the rest of your data collection.
Why does Edge show no uninstalls?
The Edge Add-ons analytics dashboard reports weekly users, enabled vs disabled, installs and impressions, but not uninstalls. Use the weekly users trend and your own uninstall page to fill the gap.
Summary
Installs tell you how many people tried your extension. Retention tells you whether it is worth keeping. Start with the store exports, and compute uninstalls per active base rather than per install so marketing spikes do not distort the trend. Add a minimal daily ping keyed by install week, not by user, to get cohort retention. Use setUninstallURL with version and cohort in the URL to learn when and why people leave. Then keep the outside view in sight, with store change alerts on your listings and your competitors', so a slide in users reaches you as a daily notification instead of a quarterly surprise.
Image credits
- Cover photo: Graph on Laptop Screen by ThisIsEngineering on Pexels, Pexels License.